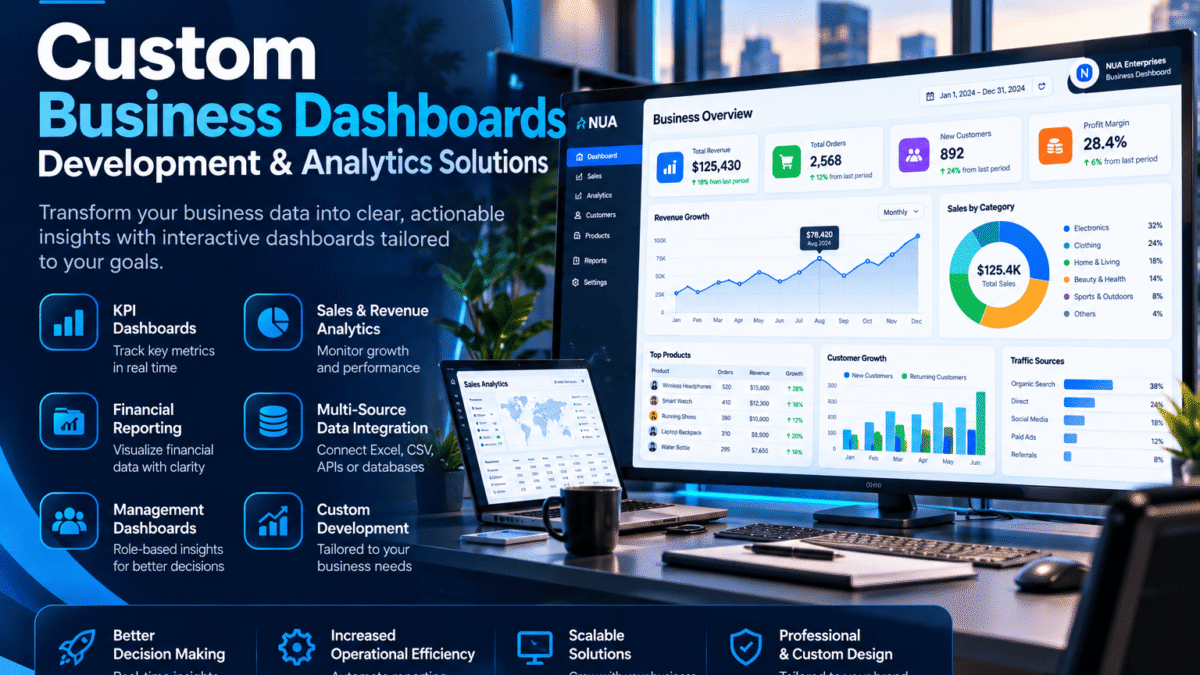
Service Description
Make informed business decisions with professional Custom Business Dashboards Development & Analytics Solutions from NUA Enterprises.
We develop tailored dashboards that help businesses organize important information, monitor key performance indicators (KPIs), visualize operational trends, and simplify management reporting.
Whether you manage a small business, online store, sales department, financial operation, or growing organization, a custom dashboard can bring important business metrics into one accessible interface.
Our Business Dashboard Development Services
1. Custom KPI Dashboards
Monitor business performance through easy-to-understand visual indicators.
Dashboard features may include:
- Key performance indicators
- Revenue and expense summaries
- Sales performance metrics
- Operational efficiency indicators
- Monthly and yearly comparisons
- Progress indicators
- Performance charts and summary cards
2. Sales & Revenue Dashboards
Track sales activity, revenue trends, and business performance.
Available features may include:
- Daily, weekly, and monthly sales summaries
- Revenue performance charts
- Sales by product or service
- Sales team performance
- Customer order analysis
- Target versus actual comparisons
- Sales growth indicators
3. Financial & Management Reporting Dashboards
Organize financial and management information into structured visual reports.
Depending on the available data, dashboards can include:
- Income and expense summaries
- Budget versus actual analysis
- Cash flow visualizations
- Outstanding receivables and payables
- Department-level financial summaries
- Management reporting indicators
- Period-based financial comparisons
These dashboards are reporting tools and do not replace professional accounting, auditing, or financial advice.
4. Interactive Data Visualization
Present complex business data using interactive visual elements.
Available visualizations may include:
- Bar charts
- Line charts
- Pie and doughnut charts
- Data tables
- KPI cards
- Trend indicators
- Date filters
- Category and department filters
5. Excel & CSV Reporting Dashboards
Convert structured spreadsheet data into practical reporting dashboards.
Services may include:
- Excel data import
- CSV file processing
- Data filtering and aggregation
- Summary calculations
- Interactive visual reports
- Period-based comparisons
- Downloadable reports where supported
6. Business Intelligence Dashboard Interfaces
Develop tailored reporting interfaces for management and operational teams.
Potential features include:
- Executive summary dashboards
- Department performance views
- Operational monitoring
- Sales and customer analytics
- Inventory reporting
- Business performance comparisons
- Role-specific dashboard views
7. Database-Connected Dashboards
For larger projects, dashboards can connect to supported databases or approved data sources.
Possible capabilities include:
- SQL database integration
- API-based data retrieval
- Automated data refresh
- Searchable reporting tables
- Data aggregation
- Historical trend reporting
Database integrations, secure authentication, and automated synchronization are quoted according to project complexity.
8. Responsive Dashboard Development
Develop dashboard interfaces designed for different screen sizes.
Features may include:
- Responsive desktop layouts
- Tablet-friendly reporting views
- Mobile dashboard interfaces
- Clear navigation
- Readable charts and tables
- User-friendly filters
Dashboard Solutions for Different Industries
NUA Enterprises can develop business dashboards for:
- Retail and eCommerce
- Banking and Financial Operations
- Real Estate Businesses
- Healthcare Administration
- Educational Institutions
- Manufacturing Companies
- Logistics and Supply Chain
- Sales and Marketing Teams
- Professional Service Businesses
- Small and Medium Enterprises
Benefits of Custom Business Dashboards
Centralized Reporting: Bring important business metrics into one interface.
Better Data Visibility: Understand trends and performance through interactive charts.
Faster Reporting: Reduce repetitive manual reporting activities where automation is supported.
Customized KPIs: Track the indicators relevant to your business objectives.
Professional Presentation: View business information through organized and visually consistent dashboards.
Scalable Development: Add additional features or data integrations as separate project phases.
Our Dashboard Development Process
Step 1 — Requirements Assessment
We discuss your business objectives, reporting requirements, target users, and available data sources.
Step 2 — Data Review
We inspect sample data and identify the calculations, metrics, and visualizations required.
Step 3 — Dashboard Design
We prepare a dashboard layout with suitable KPI cards, charts, filters, and reporting sections.
Step 4 — Development
We implement the agreed dashboard interface, calculations, and data connections within the selected package scope.
Step 5 — Testing & Validation
We review dashboard functionality, sample calculations, filters, and responsive layouts.
Step 6 — Delivery
We provide the agreed dashboard files, deployment instructions, or configured dashboard solution.
What We Need from You
- Business reporting requirements
- Sample Excel, CSV, or database data
- List of required KPIs
- Preferred charts and reports
- Reporting frequency
- Branding preferences
- Desired dashboard platform
- Data access requirements, where applicable
Please remove unnecessary personal or confidential information from sample files.
Important Service Information
Our introductory packages focus on dashboards built from clean, structured data.
Complex database integrations, enterprise authentication, hosting, ongoing maintenance, paid third-party services, extensive data cleaning, and advanced forecasting are not included unless separately agreed.
Real-time updates require a suitable data source and integration. Dashboards using manually uploaded spreadsheets do not automatically provide live information.
NUA Enterprises develops custom dashboard solutions according to the agreed technical requirements, project scope, and available data.
Improve Your Business Reporting with NUA Enterprises
Replace scattered reports with organized business dashboards that make important information easier to monitor and understand.
Our custom dashboard development services provide flexible reporting and visualization solutions for businesses seeking clearer operational and management insights.